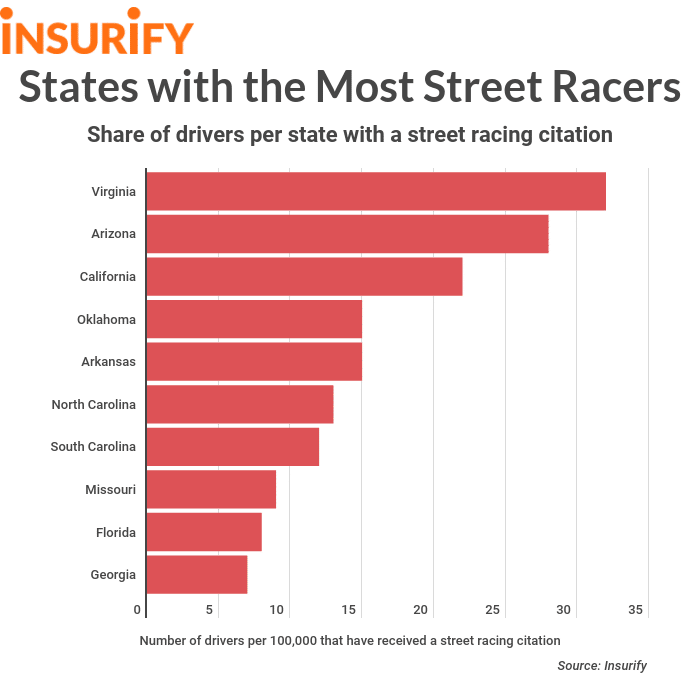
Fast and Furious: States with the Most Street Racers

Street racing exists in real life, not just movies. Here’s a look at which states have the biggest street racing problem.
Most people have seen or heard of The Fast and the Furious movie series. The franchise, which will see its ninth entry hit theaters in August, focuses heavily on a series of increasingly outlandish and risky automobile-related escapades. Among these escapades is a series of illegal races on public streets involving cars modified for speed.
Those races are unrealistic and dramatize street racing, but that doesn’t mean that street racing doesn’t occur in real life. Street racing can still be seen on American roads today, despite its illegality, and it’s becoming more of a problem. In fact, Florida just passed new legislation making it easier to convict someone of the offense.
With that in mind, the research team at Insurify, a website for comparing car insurance quotes, dove into the data to find out which states have the biggest problem with street racing.
Insights
- National averages. On average, nine out of every 100,000 drivers has received a citation for street racing. Furthermore, nationwide the average number of vehicle-related deaths per 100,000 people in 2017 was 11.4, and the percentage of drivers that had accumulated a prior speeding violation was 11.31%.
- Southern speeding. Interestingly, street racing seems to be much more popular in the South. Not a single state on the United States’ northern border ranked in the top 10, while six states in the country’s southern region made it onto the list. The three other states were split between the west and midwest regions, though they all also occupy the southern half of the country.
- Going fast doesn’t mean racing. Just because you go fast doesn’t mean that you have an inclination for racing. The data showed no significant correlation between the percentage of drivers who have been cited for speeding and the proportion of drivers who have been convicted of street racing.
Methodology
To determine which states have the highest proportion of drivers convicted of street racing, the data science team at Insurify, a website to compare car insurance quotes, ran the numbers from its database of over 1.6 million car insurance applications. To apply for quotes, drivers disclose vehicle information as well as driving history, including whether they have committed a street racing violation. The number of drivers convicted for street racing was analyzed against the total number of drivers in each state to find the share of drivers with street racing on their record. The 10 highest proportions were then selected. Data on the percentage of drivers with a prior speeding ticket was also gathered from the Insurify database. Numbers regarding the amount of deaths per 100,000 people was taken from data gathered in 2017 by the Insurance Institute for Highway Safety (IIHS).

10. Georgia
- Proportion of drivers with a street racing violation: 7 in 100,000
- Percentage of drivers with a prior speeding ticket: 10.36%
- Vehicle-related deaths per 100,000 people: 14.8
Street racing in the Peach State—which has the 10th highest proportion of offenders nationwide—has certainly been in the news lately. A street-racing crash that killed two people in the Atlanta area in April 2019 has led to a petition to create harsher punishments for the crime, which is currently a misdemeanor in Georgia. The state also has other driving problems, though, with a rate of car-related deaths per 100,000 people higher the national average.
9. Florida
- Proportion of drivers with a street racing violation: 8 in 100,000
- Percentage of drivers with a prior speeding ticket: 7.12%
- Vehicle-related deaths per 100,000 people: 14.8
Georgia isn’t the only southern state trying to crack down on street racing. Florida governor Ron DeSantis recently signed a bill making it easier for law enforcement to cite people for reckless street races. Before, officers were required to witness the race in order to charge people with a crime. But the new bill makes it so that other methods, such as video or eyewitness accounts, can be used as evidence. Interestingly, despite having the ninth-highest rate of street racing in the country, Florida’s rate of speeding tickets is remarkably low. Their proportion of drivers with a prior speeding conviction is fifth-lowest in the country.
8. Missouri
- Proportion of drivers with a street racing violation: 9 in 100,000
- Percentage of drivers with a prior speeding ticket: 11.56%
- Vehicle-related deaths per 100,000 people: 15.2
Missouri, unlike Florida, does have a big problem with speeding in general. Its rate of drivers with speeding tickets checks in above the national average. In addition, the Show-Me State has a share of vehicle-related deaths 33 percent above the national average. Those statistics combine to show that street racing isn’t the only driving-related issue Missouri is looking for a way to combat.
7. South Carolina
- Proportion of drivers with a street racing violation: 12 in 100,000
- Percentage of drivers with a prior speeding ticket: 16.49%
- Vehicle-related deaths per 100,000 people: 19.7
South Carolina, the third Southern state on the list, is also worse than average in all three statistics listed above. In fact, it is the second worst state in the country in both share of vehicle-related deaths, as well as the percentage of drivers with a speeding ticket. Of course, it doesn’t help that South Carolina has some of the most lenient speeding laws in the country. For comparison, the maximum fine for speeding up to 10 miles over the limit there was $81.88 in 2015. In Florida, the number nine state on the countdown, that same fine goes up to $151.
6. North Carolina
- Proportion of drivers with a street racing violation: 13 in 100,000
- Percentage of drivers with a prior speeding ticket: 11.15%
- Vehicle-related deaths per 100,000 people: 13.7
Despite claiming the number six spot on this list, North Carolina actually ranks below the national average in both proportion of drivers with a speeding ticket—unlike its south-of-the-border neighbor. However, it does have a rate of death higher than the national average by more than two deaths per 100,000.
5. Arkansas
- Proportion of drivers with a street racing violation: 15 in 100,000
- Percentage of drivers with a prior speeding ticket: 9.17%
- Vehicle-related deaths per 100,000 people: 16.4
Despite making it into the top five states for street racing in the United States, not very many people in Arkansas get pulled over for speeding. The state’s percentage of drivers with a speeding ticket is among the 15 best in the country. Not only that, but the Natural State also has fewer motorists with a DWI violation than average. In spite of that, Arkansas’s fatality rate is still among the 10 worst in the country. One possible reason for that? Just six states have a lower rate of seatbelt usage than Arkansas does.
4. Oklahoma
- Proportion of drivers with a street racing violation: 15 in 100,000
- Percentage of drivers with a prior speeding ticket: 9.75%
- Vehicle-related deaths per 100,000 people: 16.7
Oklahoma, just like Arkansas, has a fatality rate that ranks in the top 10 nationwide despite having a percentage of drivers with speeding tickets below the national mean. Interestingly, though, Oklahoma’s seatbelt usage is much better—86.9 percent of drivers remember to buckle up—and its drivers are actually very safe. Just 9.3 percent of motorists there have at least one at-fault accident—that’s the fourth lowest rate of any state.
3. California
- Proportion of drivers with a street racing violation: 22 in 100,000
- Percentage of drivers with a prior speeding ticket: 7.88%
- Vehicle-related deaths per 100,000 people: 9.1
Street racing is a well-documented problem throughout California. Up to 15 people were arrested and nearly 30 vehicles were impounded at a small parking lot gathering of racers in Corona in late June 2019. In fact, at least 179 people since 2000 have died as a result of the practice in Los Angeles alone, according to the L.A. Times. So it’s no surprise that California has the third highest proportion of street racers nationwide. However, certain cities in the state are certainly working to crack down. A new law recently passed by the San Jose City Council makes it illegal to even watch a street race, with fines up to $1,000 and jail time up to six months for spectators.
2. Arizona
- Proportion of drivers with a street racing violation: 28 in 100,000
- Percentage of drivers with a prior speeding ticket: 9.23%
- Vehicle-related deaths per 100,000 people: 14.3
Arizona has a proportion of street racers nearly three times the national average, despite severe laws banning the practice. First offenders can be punished by fines up to $2,500, as well as six months in jail. By comparison, Oklahoma, which checks in at number four on the list, only levies a $500 dollar fine and up to 90 days of jail time for a first violation.
1. Virginia
- Proportion of drivers with a street racing violation: 32 in 100,000
- Percentage of drivers with a prior speeding ticket: 16.49%
- Vehicle-related deaths per 100,000 people: 9.9
No state has a bigger issue with street racing than Virginia, whose share of drivers convicted of the crime is nearly 50 percent larger than Arizona, which ranks second. Even when drivers aren’t racing, though, Virginia has an issue with people driving too quickly. Its rate of drivers with prior speeding tickets is tied for second-highest in the country. The state also has a percentage of drivers with a prior at-fault accident greater than the national average, as well as the ninth highest percentage of motorists with a prior driving incident of any state.
More From Shore Sports Network